SEE HOW PRICE REACTS TO VARIOUS EVENTS
Show Event Markers on Your Charts
Earnings, notes, videos & more real-time financial content.
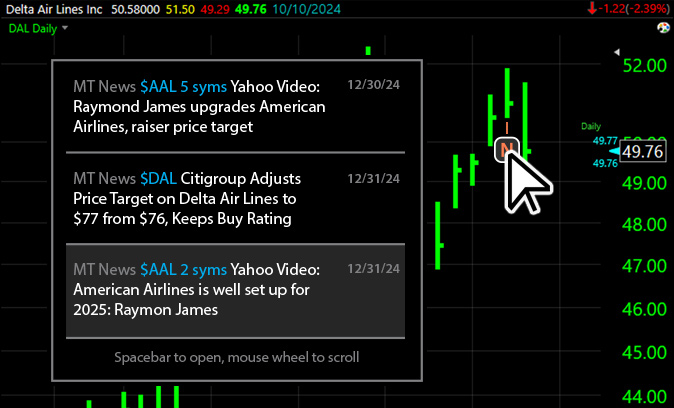
Preview events and headlines from your chart. Choose full stories & on-demand videos. Show event markers on your charts to see how earnings, news stories, analyst ratings and price behave together. View full stories and on-demand videos directly from a chart marker or a headline. Step through stories chronologically or jump directly to any marker on the chart.


Watch this short video:
- Access top news throughout the day
- Quickly preview headlines from any marker on the chart
- Organize news by category and ticker symbols
Show markers for following categories:
- Earnings
- Dividends
- Splits
- Personal Notes
- Top News
- Analyst Ratings
- IPO's, Mergers & Acquisitions
- Insiders
- Market Sector Summaries
- Global Economics & Fed
- Closing Bell
- On-demand Yahoo Finance & Bloomberg Videos
